> ## Documentation Index
> Fetch the complete documentation index at: https://polyai-mintlify-7055a538.mintlify.site/llms.txt
> Use this file to discover all available pages before exploring further.
# Self-serve dashboards
> Build and customise your own dashboards on the Analytics page.
The Analytics page shows how your agent performs. You can customise it yourself or have [Wren](/wren/analyze) do it for you.
Open it from **Analyze > Analytics** in the left menu.
For dashboards that PolyAI builds and maintains for you, see [Managed dashboards](/analytics/dashboards/custom) under **Analyze > Dashboards**.
 For quick workflows using dashboards, see [QA and analytics](/learn/maintain/qa-analytics). For in-depth performance analysis, see [Performance monitoring](/learn/maintain/performance-monitoring).
## Dashboards and tabs
Each tab is one dashboard. The **Overview** tab is the default dashboard.
To add a dashboard, select **+** next to the tabs. You then pick one of these:
| Option | What it gives you |
| ---------------- | ---------------------------------------------------------------- |
| Overview | Conversation volume, containment, PolyScore and handle time. |
| Inbound voice | Call volume, containment and transfer reasons for inbound calls. |
| Outbound voice | Connect rate, completion, callback outcomes and talk time. |
| Web chat | Engaged conversations, messages, containment and PolyScore. |
| Custom dashboard | An empty dashboard that you build yourself. |
The first four options are **templates**. A template is a set of tiles that the platform creates for you. After you create the dashboard, the tiles belong to you. You can change, move, or delete any of them. A template saves you the setup work. It does not lock you in.
To manage a dashboard, select the **⋮** icon on its tab. You can rename it, edit it, duplicate it, set it as the default, or delete it.
To try a change safely, select **Duplicate** first. Edit the copy and keep the original.
## The default Overview tiles
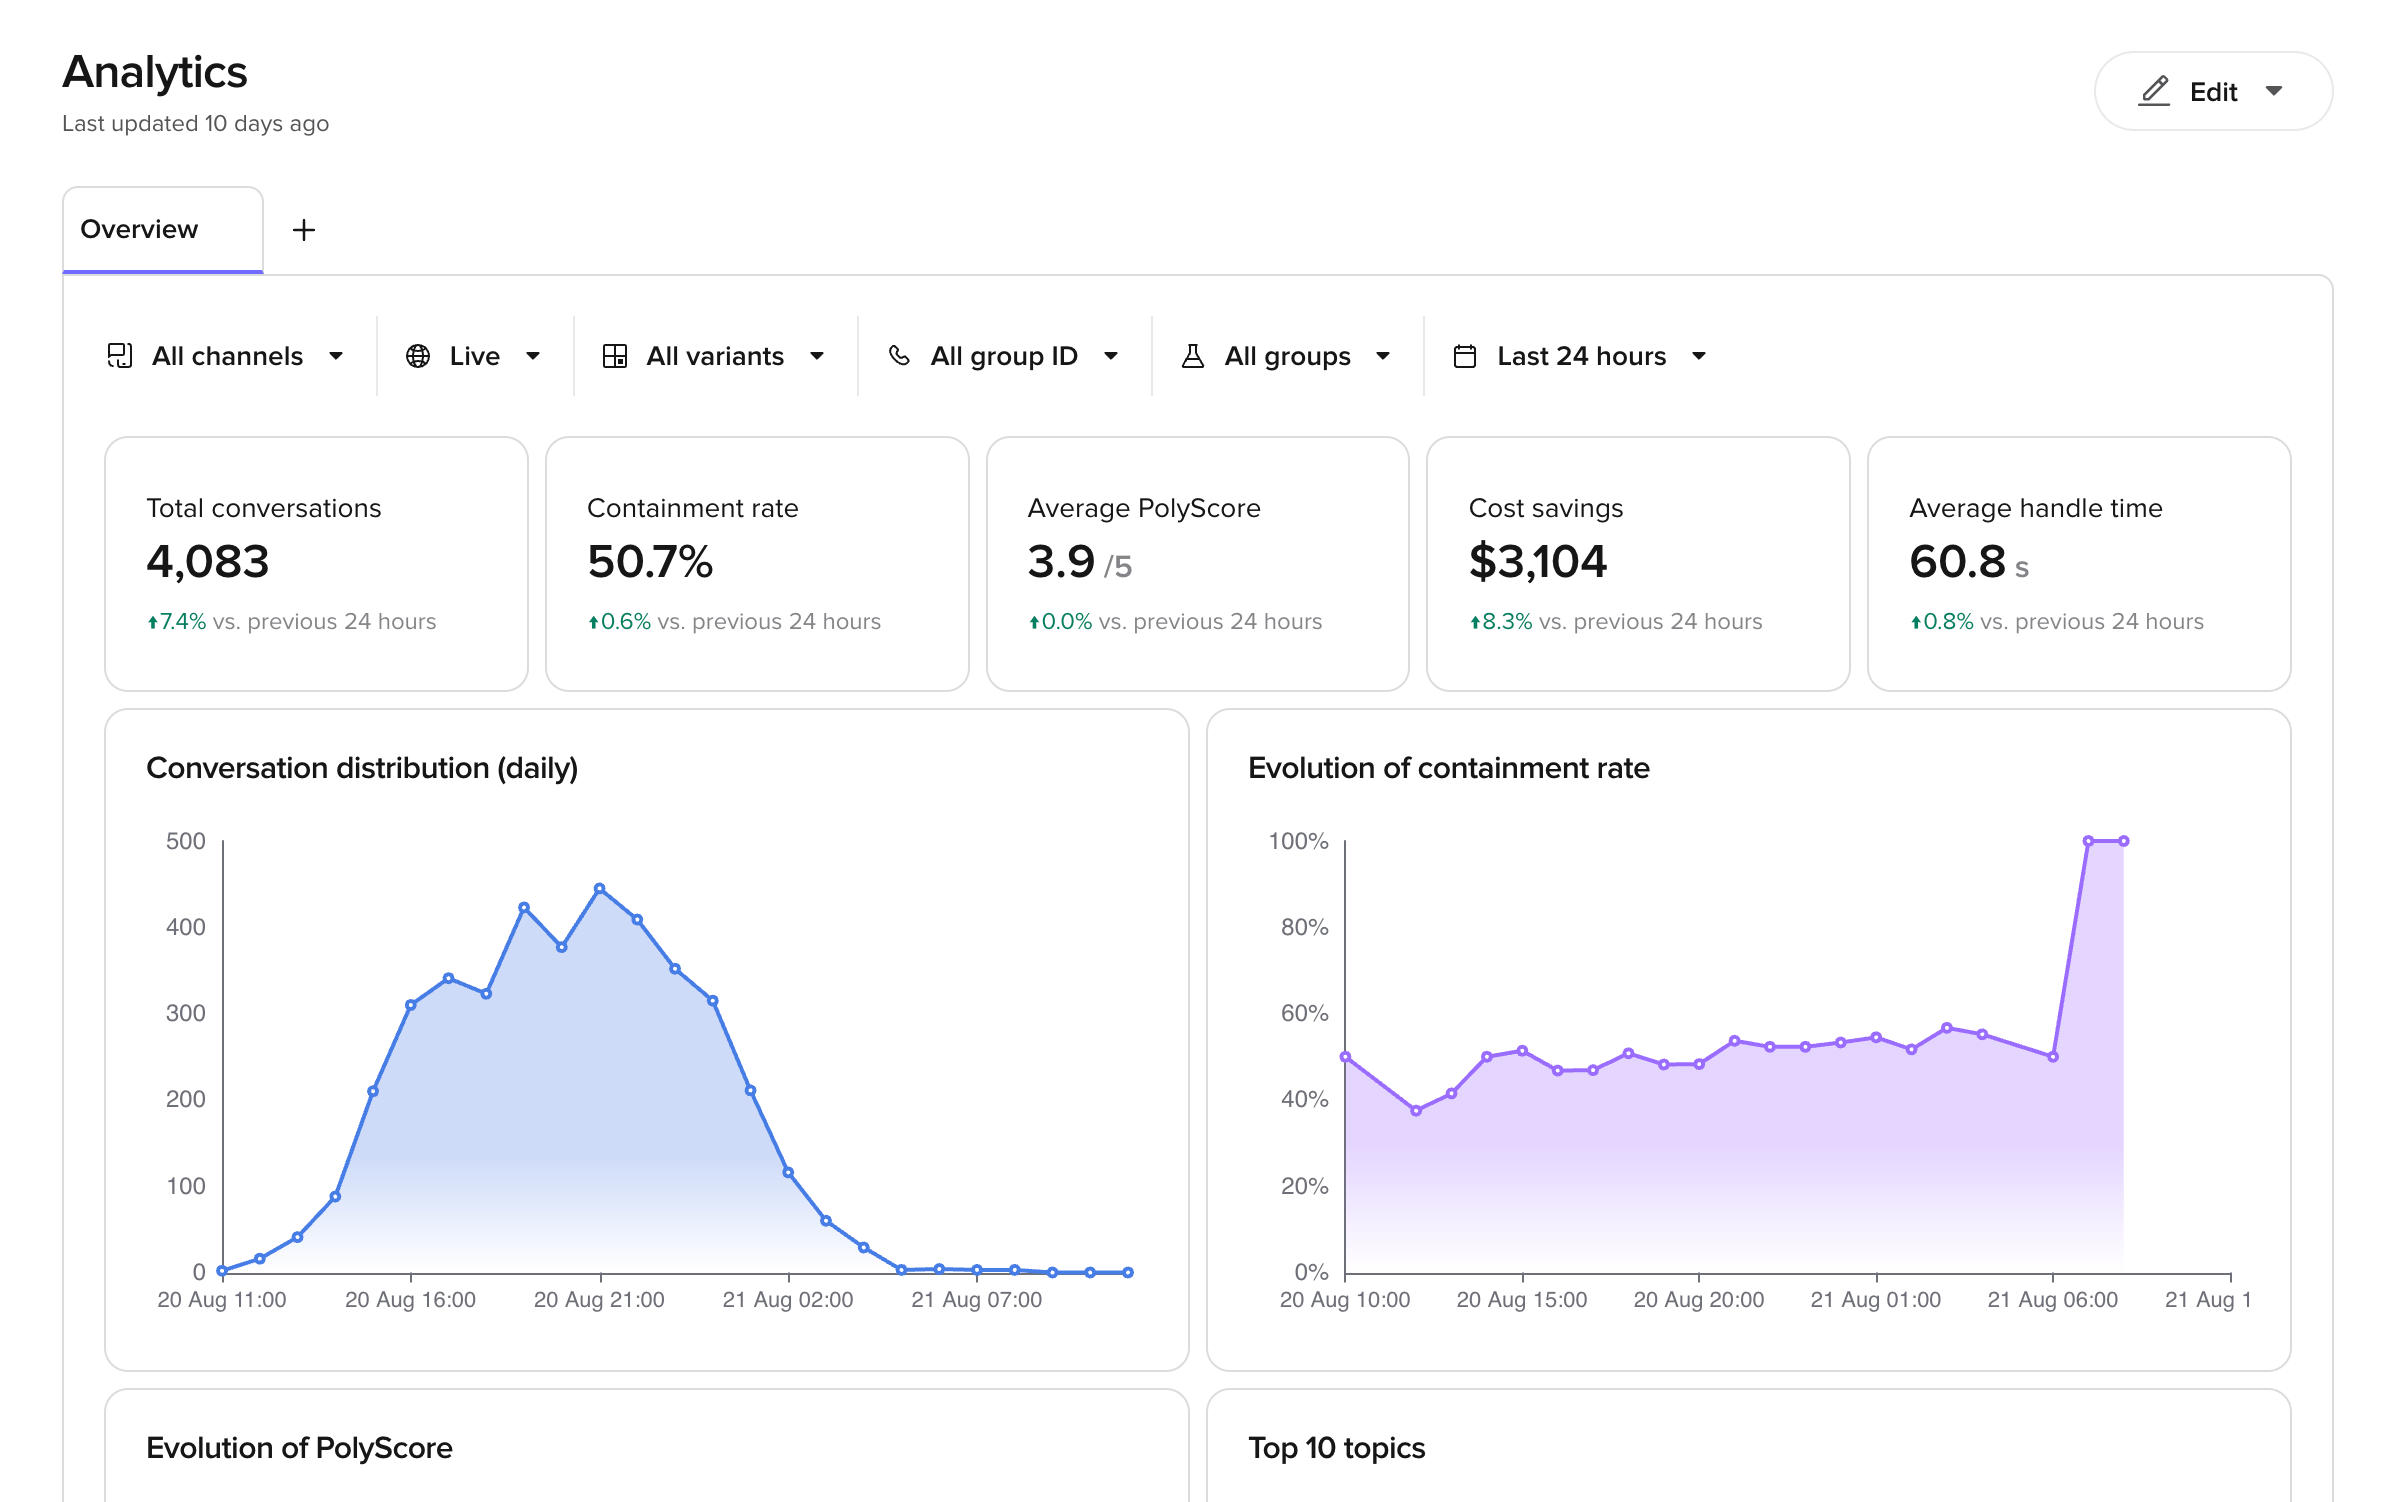
A new Overview dashboard starts with five headline numbers. Each one shows the change against the previous period of the same length.
| Tile | What it shows by default |
| ------------------- | ----------------------------------------------------------------------------------------- |
| Total conversations | The number of conversations in the selected period. |
| Containment rate | The percentage of conversations that the agent completed without a transfer to a human. |
| Average PolyScore | A quality score from 0 to 5 for each conversation. See [PolyScore](/analytics/polyscore). |
| Cost savings | An estimate of the money saved against a human agent. |
| Average handle time | The average conversation length in seconds. |
It also starts with four charts: **Conversation distribution (daily)**, **Evolution of containment rate**, **Evolution of PolyScore** and **Top 10 topics**.
Treat these as defaults, not as rules. Each tile is a metric, an aggregation and a format that you can open and change. For example, the **Cost savings** tile multiplies the total AI-only call duration by a rate per second. That rate is a field on the tile. If your agents cost more or less, open the tile and change it.
## Filters
The toolbar above the tiles filters every tile at the same time.
* **Channels** — voice or chat.
* **Deployment** — the environment, for example `Live`.
* **Variants** — the agent version or site.
* **Group ID** — the [A/B test](/environments-and-versions/ab-testing) deployment.
* **Groups** — the arm of the A/B test, either the control group or a test variant.
* **Date range** — a preset period, for example `Last 7 days`, or a custom range.
Use **Group ID** and **Groups** together to compare a test variant against the control.
These filters do not change the dashboard. They change only what you look at right now. To narrow one tile permanently, use a tile filter instead.
## Edit a dashboard
### Open the editor
1. Select the **⋮** icon on the dashboard tab.
2. Select **Edit dashboard**.
The header changes to **Edit dashboard**. You now see three controls:
* **←** returns to the dashboard.
* **+ Tile** adds a new tile.
* **Save dashboard** saves your changes. This button stays inactive until you make a change.
Your changes go live only when you select **Save dashboard**. If you leave the editor without saving, the dashboard stays as it was.
### Rearrange and resize tiles
* To move a tile, drag the **⠿** handle to the left of the tile title.
* To resize a tile, drag the grip in the bottom right corner of the tile.
### Add, edit and delete tiles
* To add a tile, select **+ Tile**, configure it, then select **Add to dashboard**.
* To edit a tile, select the **⋮** icon on the tile, then select **Edit**. Select **Update** to apply your changes.
* To delete a tile, select the **⋮** icon on the tile, then select **Delete**.
The dashboard behind the panel updates as you change settings. Use it as a live preview. Select **Cancel** to close the panel and discard the tile changes.
## What you can customise on a tile
The tile panel has three parts: **Visualize as**, the **Data** tab and the **Format** tab.
### Visualize as
Pick the tile type: **Line**, **Bar**, **Donut**, **Table**, **Heatmap**, **KPI tile** or **Pie**. You can change the type at any time. Your data settings stay in place. Switch between types to see which one reads best.
### Data tab
**Metric** — the value the tile measures. Select the **Metric** field to open the list of pre-built metrics, for example `Call duration` or `Chat abandoned`. Use the search box to find a metric by name. To chart your own outcomes, define them first — see [Custom metrics](/analytics/kpis/introduction).
**Aggregation** — how the platform combines the values. The options are:
| Aggregation | Use it for |
| ------------------ | ---------------------------------------------------------------------- |
| Count | The number of records. |
| Conversation count | The number of distinct conversations. |
| Sum | The total of all values. |
| Average | The mean value. |
| Min / Max | The lowest or highest value. |
| P50 / P95 / P99 | Percentiles. P95 shows the value that 95% of conversations stay below. |
Averages hide outliers. If you track call duration, add a P95 tile next to the average.
**Breakdown** — splits the tile by a dimension. Set:
* **Group by** — the dimension to split by, for example channel or variant.
* **Sort** — `None`, `Ascending` or `Descending`.
* **Limit results** — the maximum number of groups to show. Use it for a top-10 chart.
**Filter (optional)** — narrows the tile to a subset of conversations. Select **+ Filter**, then build a `Where` condition. Add more conditions to narrow the tile further. This filter applies to this tile only. It does not change the other tiles.
For example, to count only conversations that the agent finished alone, filter on `Where Handoff to Is not present`.
### Format tab
The options change with the tile type.
For charts (line, bar, pie, donut, heatmap):
* **Chart title** — the name shown on the tile. Rename tiles to match the words your team uses.
* **Show area fill** — fills the area under a line.
* **Show gridlines** — adds horizontal guide lines.
* **Empty buckets** — choose `Show as zero` or `Connect points` for periods with no data.
* **Chart color** — pick one of eight colours. Use the same colour for related tiles.
* **Divided by** — select a second metric to show the result as a rate.
* **Y-axis label** — the label on the vertical axis.
For a KPI tile:
* **Chart title** — the name shown on the tile.
* **Show change vs. previous period** — adds the percentage change badge.
* **Show as** — `Number`, `Percent (%)` or `Currency`.
* **Multiply result by** — a multiplier. Use it to apply a rate or convert a unit.
* **Value suffix** — a unit to show after the value, for example `s`.
* **Divided by** — select a second metric to show the result as a rate.
To build a rate, set **Divided by** to the base metric and set **Show as** to `Percent (%)`. The tile then shows the first metric as a percentage of the second.
### Table tiles
A table tile has its own settings on the **Data** tab:
1. Under **Row**, pick what each row represents: `Channel`, `Deployment`, `Value` or `Variant`.
2. Under **Column**, configure each column:
* **Metric** — the value in the column.
* **Measured as** — the aggregation.
* **Show as** — `Number`, `Percent (%)` or `Duration`.
* **Divided by** — an optional second metric, to show a rate.
* **Filters (optional)** — counts only conversations that match every filter you add.
3. Select **+ Column** to add more columns.
Use a table when you compare the same metrics across sites, variants or channels.
## Wren integration
Each chart has **Generate insights** and **Create analysis** buttons that open [Wren](/wren/analyze) with a pre-populated prompt based on that chart's data.
Wren can also build dashboards for you. Ask it in natural language instead of using the editor.
## Related pages
Dashboards that PolyAI builds and maintains for your organisation.
Define the metrics that power your dashboards.
Drill into individual calls behind your dashboard metrics.
Ask Wren to investigate trends with natural-language queries.
How PolyAI scores conversation quality.
Extract structured fields from a transcript after the call ends.
For quick workflows using dashboards, see [QA and analytics](/learn/maintain/qa-analytics). For in-depth performance analysis, see [Performance monitoring](/learn/maintain/performance-monitoring).
## Dashboards and tabs
Each tab is one dashboard. The **Overview** tab is the default dashboard.
To add a dashboard, select **+** next to the tabs. You then pick one of these:
| Option | What it gives you |
| ---------------- | ---------------------------------------------------------------- |
| Overview | Conversation volume, containment, PolyScore and handle time. |
| Inbound voice | Call volume, containment and transfer reasons for inbound calls. |
| Outbound voice | Connect rate, completion, callback outcomes and talk time. |
| Web chat | Engaged conversations, messages, containment and PolyScore. |
| Custom dashboard | An empty dashboard that you build yourself. |
The first four options are **templates**. A template is a set of tiles that the platform creates for you. After you create the dashboard, the tiles belong to you. You can change, move, or delete any of them. A template saves you the setup work. It does not lock you in.
To manage a dashboard, select the **⋮** icon on its tab. You can rename it, edit it, duplicate it, set it as the default, or delete it.
To try a change safely, select **Duplicate** first. Edit the copy and keep the original.
## The default Overview tiles
A new Overview dashboard starts with five headline numbers. Each one shows the change against the previous period of the same length.
| Tile | What it shows by default |
| ------------------- | ----------------------------------------------------------------------------------------- |
| Total conversations | The number of conversations in the selected period. |
| Containment rate | The percentage of conversations that the agent completed without a transfer to a human. |
| Average PolyScore | A quality score from 0 to 5 for each conversation. See [PolyScore](/analytics/polyscore). |
| Cost savings | An estimate of the money saved against a human agent. |
| Average handle time | The average conversation length in seconds. |
It also starts with four charts: **Conversation distribution (daily)**, **Evolution of containment rate**, **Evolution of PolyScore** and **Top 10 topics**.
Treat these as defaults, not as rules. Each tile is a metric, an aggregation and a format that you can open and change. For example, the **Cost savings** tile multiplies the total AI-only call duration by a rate per second. That rate is a field on the tile. If your agents cost more or less, open the tile and change it.
## Filters
The toolbar above the tiles filters every tile at the same time.
* **Channels** — voice or chat.
* **Deployment** — the environment, for example `Live`.
* **Variants** — the agent version or site.
* **Group ID** — the [A/B test](/environments-and-versions/ab-testing) deployment.
* **Groups** — the arm of the A/B test, either the control group or a test variant.
* **Date range** — a preset period, for example `Last 7 days`, or a custom range.
Use **Group ID** and **Groups** together to compare a test variant against the control.
These filters do not change the dashboard. They change only what you look at right now. To narrow one tile permanently, use a tile filter instead.
## Edit a dashboard
### Open the editor
1. Select the **⋮** icon on the dashboard tab.
2. Select **Edit dashboard**.
The header changes to **Edit dashboard**. You now see three controls:
* **←** returns to the dashboard.
* **+ Tile** adds a new tile.
* **Save dashboard** saves your changes. This button stays inactive until you make a change.
Your changes go live only when you select **Save dashboard**. If you leave the editor without saving, the dashboard stays as it was.
### Rearrange and resize tiles
* To move a tile, drag the **⠿** handle to the left of the tile title.
* To resize a tile, drag the grip in the bottom right corner of the tile.
### Add, edit and delete tiles
* To add a tile, select **+ Tile**, configure it, then select **Add to dashboard**.
* To edit a tile, select the **⋮** icon on the tile, then select **Edit**. Select **Update** to apply your changes.
* To delete a tile, select the **⋮** icon on the tile, then select **Delete**.
The dashboard behind the panel updates as you change settings. Use it as a live preview. Select **Cancel** to close the panel and discard the tile changes.
## What you can customise on a tile
The tile panel has three parts: **Visualize as**, the **Data** tab and the **Format** tab.
### Visualize as
Pick the tile type: **Line**, **Bar**, **Donut**, **Table**, **Heatmap**, **KPI tile** or **Pie**. You can change the type at any time. Your data settings stay in place. Switch between types to see which one reads best.
### Data tab
**Metric** — the value the tile measures. Select the **Metric** field to open the list of pre-built metrics, for example `Call duration` or `Chat abandoned`. Use the search box to find a metric by name. To chart your own outcomes, define them first — see [Custom metrics](/analytics/kpis/introduction).
**Aggregation** — how the platform combines the values. The options are:
| Aggregation | Use it for |
| ------------------ | ---------------------------------------------------------------------- |
| Count | The number of records. |
| Conversation count | The number of distinct conversations. |
| Sum | The total of all values. |
| Average | The mean value. |
| Min / Max | The lowest or highest value. |
| P50 / P95 / P99 | Percentiles. P95 shows the value that 95% of conversations stay below. |
Averages hide outliers. If you track call duration, add a P95 tile next to the average.
**Breakdown** — splits the tile by a dimension. Set:
* **Group by** — the dimension to split by, for example channel or variant.
* **Sort** — `None`, `Ascending` or `Descending`.
* **Limit results** — the maximum number of groups to show. Use it for a top-10 chart.
**Filter (optional)** — narrows the tile to a subset of conversations. Select **+ Filter**, then build a `Where` condition. Add more conditions to narrow the tile further. This filter applies to this tile only. It does not change the other tiles.
For example, to count only conversations that the agent finished alone, filter on `Where Handoff to Is not present`.
### Format tab
The options change with the tile type.
For charts (line, bar, pie, donut, heatmap):
* **Chart title** — the name shown on the tile. Rename tiles to match the words your team uses.
* **Show area fill** — fills the area under a line.
* **Show gridlines** — adds horizontal guide lines.
* **Empty buckets** — choose `Show as zero` or `Connect points` for periods with no data.
* **Chart color** — pick one of eight colours. Use the same colour for related tiles.
* **Divided by** — select a second metric to show the result as a rate.
* **Y-axis label** — the label on the vertical axis.
For a KPI tile:
* **Chart title** — the name shown on the tile.
* **Show change vs. previous period** — adds the percentage change badge.
* **Show as** — `Number`, `Percent (%)` or `Currency`.
* **Multiply result by** — a multiplier. Use it to apply a rate or convert a unit.
* **Value suffix** — a unit to show after the value, for example `s`.
* **Divided by** — select a second metric to show the result as a rate.
To build a rate, set **Divided by** to the base metric and set **Show as** to `Percent (%)`. The tile then shows the first metric as a percentage of the second.
### Table tiles
A table tile has its own settings on the **Data** tab:
1. Under **Row**, pick what each row represents: `Channel`, `Deployment`, `Value` or `Variant`.
2. Under **Column**, configure each column:
* **Metric** — the value in the column.
* **Measured as** — the aggregation.
* **Show as** — `Number`, `Percent (%)` or `Duration`.
* **Divided by** — an optional second metric, to show a rate.
* **Filters (optional)** — counts only conversations that match every filter you add.
3. Select **+ Column** to add more columns.
Use a table when you compare the same metrics across sites, variants or channels.
## Wren integration
Each chart has **Generate insights** and **Create analysis** buttons that open [Wren](/wren/analyze) with a pre-populated prompt based on that chart's data.
Wren can also build dashboards for you. Ask it in natural language instead of using the editor.
## Related pages
Dashboards that PolyAI builds and maintains for your organisation.
Define the metrics that power your dashboards.
Drill into individual calls behind your dashboard metrics.
Ask Wren to investigate trends with natural-language queries.
How PolyAI scores conversation quality.
Extract structured fields from a transcript after the call ends.