> ## Documentation Index
> Fetch the complete documentation index at: https://polyai-mintlify-7055a538.mintlify.site/llms.txt
> Use this file to discover all available pages before exploring further.
# Managed dashboards
> Dashboards that PolyAI builds and maintains for your organisation.
Managed dashboards are dashboards that PolyAI builds and maintains for your organisation.
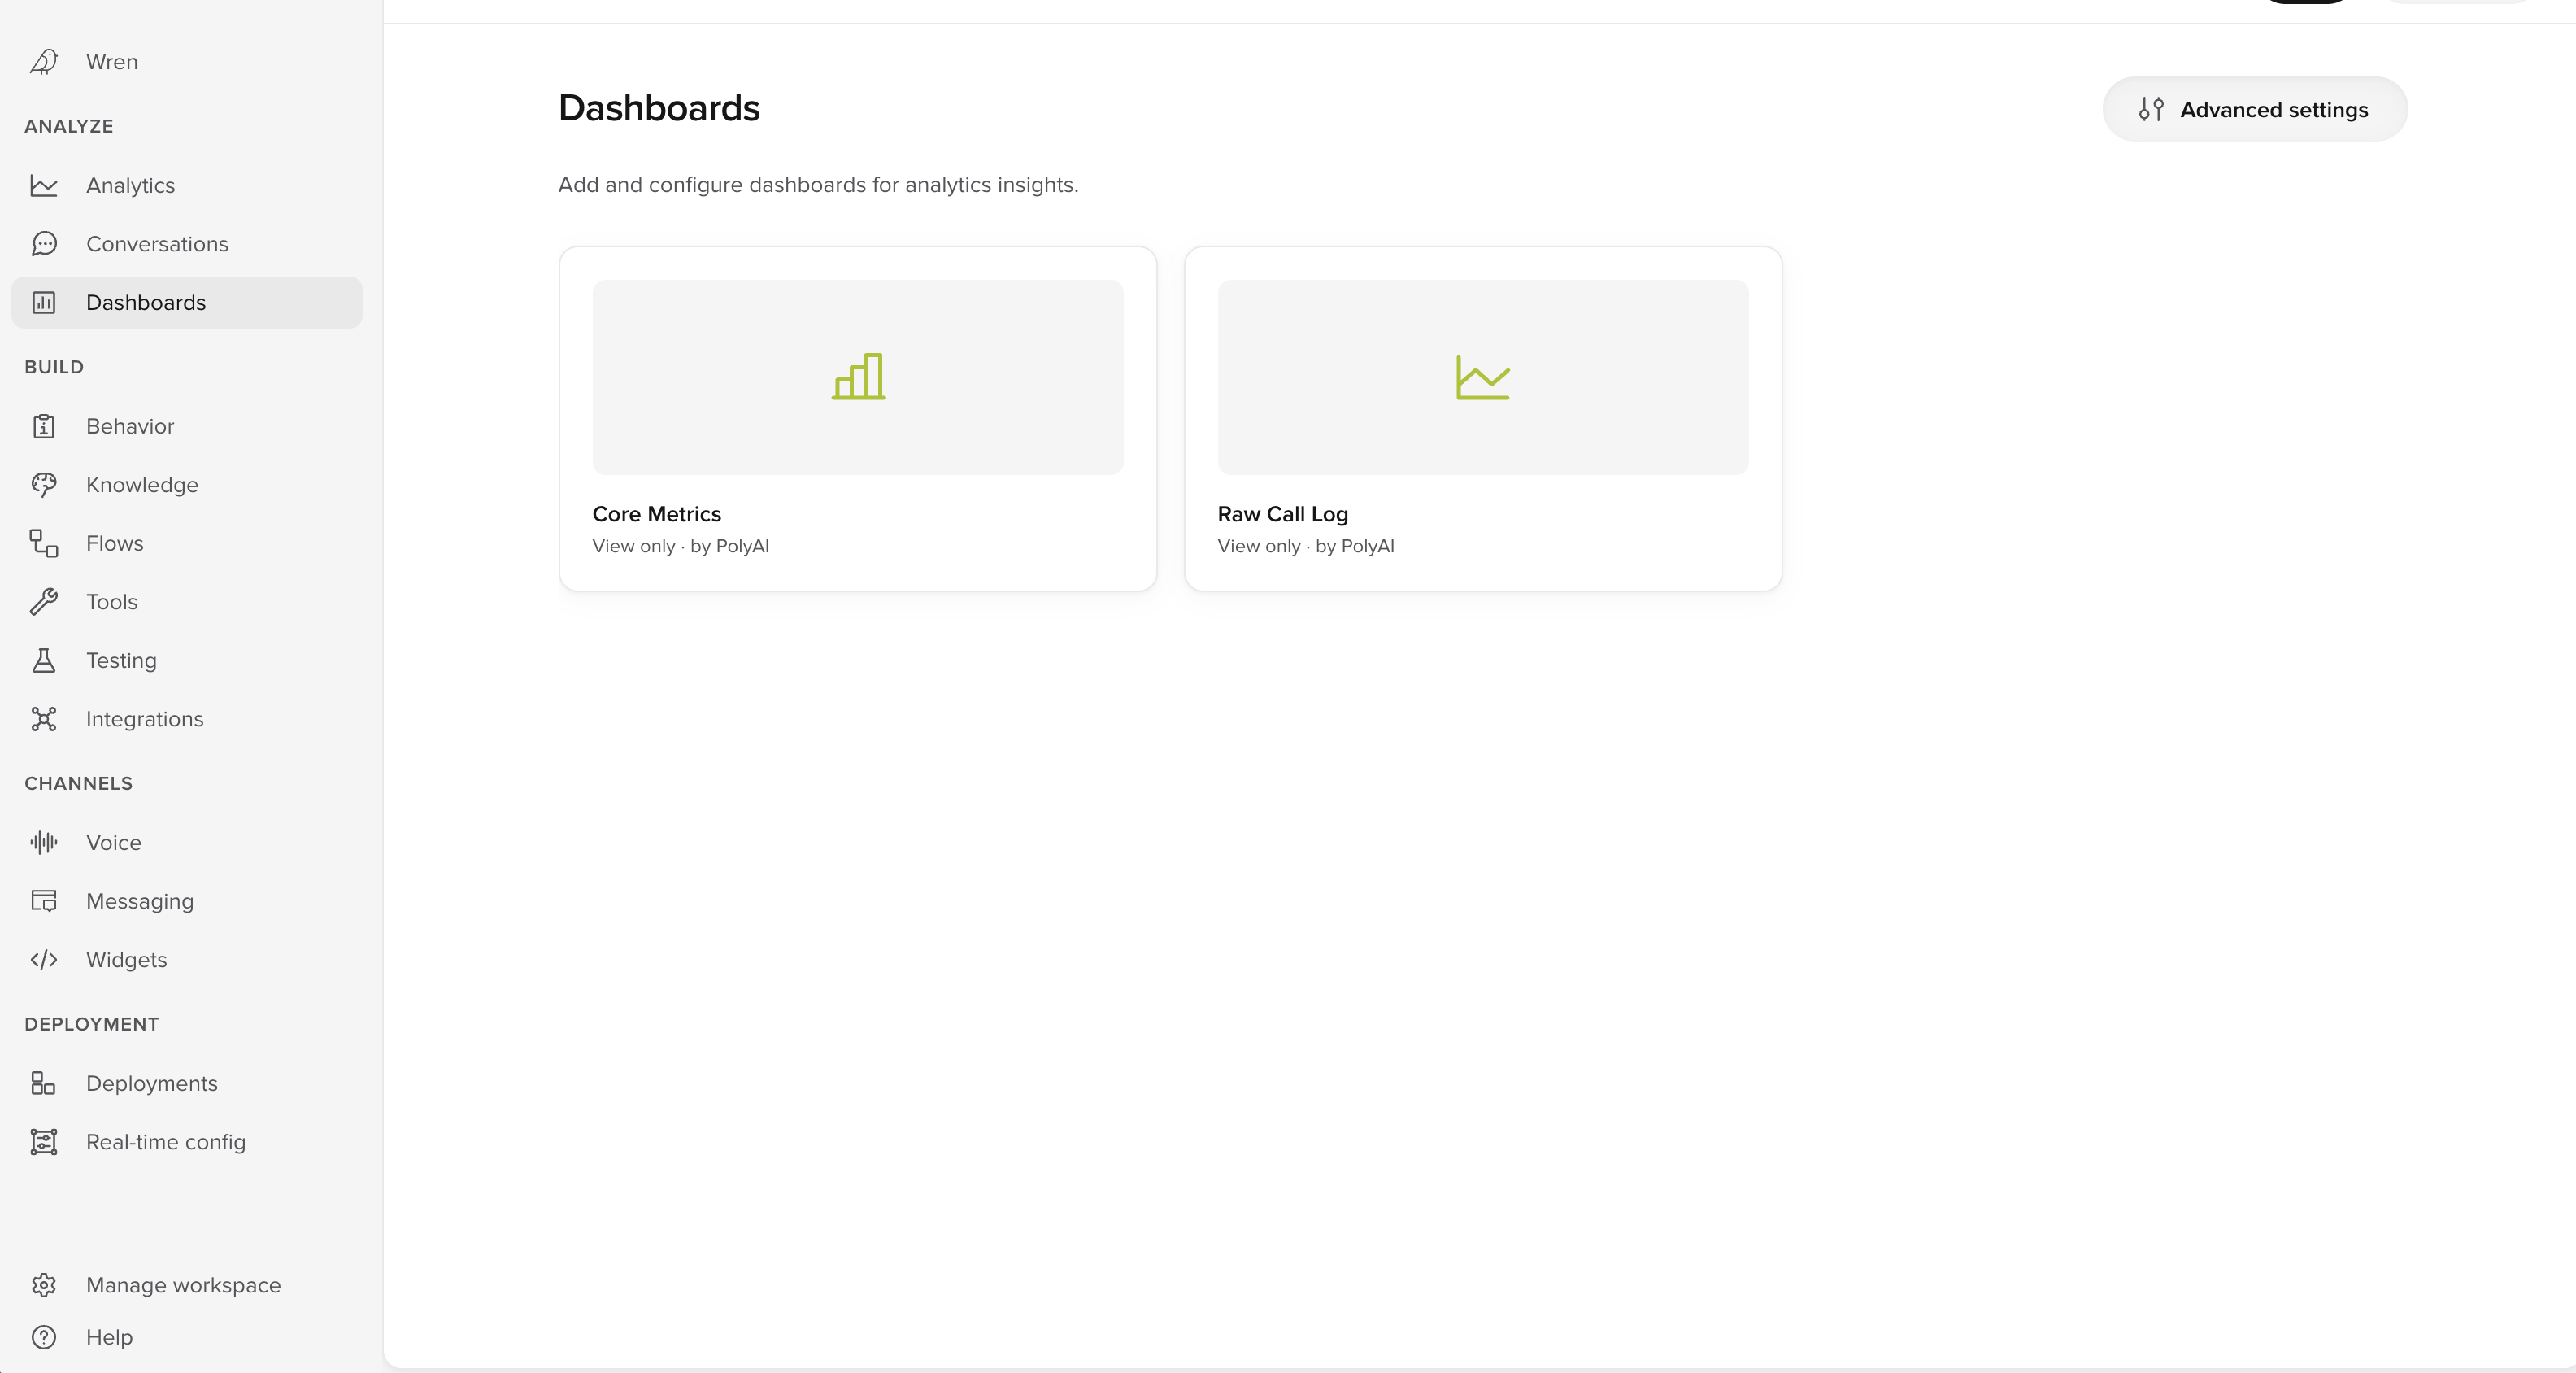
Find them in Agent Studio under **Analyze > Dashboards**.
Use a managed dashboard when you need reporting that goes beyond what you build yourself. To build and edit dashboards without PolyAI, see [Self-serve dashboards](/analytics/dashboards/introduction).
 ## Managed or self-serve?
| | Managed dashboards | Self-serve dashboards |
| ----------------- | ----------------------------------------------------------------------------------------- | ------------------------------------- |
| Where | **Analyze > Dashboards** | **Analyze > Analytics** |
| Who builds it | PolyAI, with your team. Your team can also build them if you enable QuickSight Authoring. | You, or Wren |
| How you change it | Request a change from your account manager, or use QuickSight Authoring | Edit it yourself at any time |
| Best for | Bespoke KPIs, complex data joins, board reporting | Day-to-day metrics and fast iteration |
Both types are embedded in Agent Studio. You do not need a separate login or an external tool.
## Find your dashboards
1. In the left menu, select **Dashboards** under **ANALYZE**.
2. Select the dashboard you want to open.
Each dashboard appears as a card with its name. Cards that PolyAI builds and maintains are marked **View only · by PolyAI**.
If your project has no dashboards yet, the page shows **No dashboards configured**. Contact your PolyAI team to set them up.
## What a managed dashboard includes
A managed dashboard can track any combination of metrics relevant to your use case. Common examples include:
| Metric | Description |
| ----------------------------- | ---------------------------------------------------------------------------------------------------- |
| **Containment rate** | Percentage of queries resolved by the agent without escalation or [handoff](/voice-channel/handoffs) |
| **Booking performance** | Success rates, conversion funnels, and failure reasons for booking interactions |
| **Call resolution breakdown** | Categorized call outcomes (resolved, transferred, abandoned) with drill-down capability |
| **Call flows and outcomes** | Visual maps of customer journeys showing which paths lead to successful resolution |
| **Revenue impact** | Bookings completed, upsells, or payments processed by the agent |
| **Custom function metrics** | Performance data from your specific [functions](/tools/introduction) and integrations |
Managed dashboards run on **Amazon Quick** (formerly Amazon QuickSight). PolyAI manages that connection for you.
## How to get a managed dashboard
Managed dashboards are available to enterprise customers.
1. Contact your PolyAI account manager.
2. Agree the metrics and KPIs you need.
3. PolyAI designs and builds the dashboard.
4. Review the dashboard in your Sandbox environment.
5. PolyAI deploys it for your team.
## Advanced settings
Select **Advanced settings** to see the dashboard connection for your project. PolyAI configures this during setup, so most teams never need to open it. It is where a dashboard gets linked, given a URL name, and scoped to a single project.
If a dashboard fails to load, the page reports one of two problems:
* The dashboard is not available on Amazon Quick. Check that it still exists.
* The dashboard filters are configured incorrectly on Amazon Quick.
Contact your PolyAI team if you see either message.
### QuickSight Authoring
QuickSight Authoring lets your team create and edit QuickSight dashboards directly. Use it when you want to change a managed dashboard without a request to your account manager.
Two conditions apply:
* QuickSight Authoring is available on demand to enterprise customers. To enable it, contact PolyAI.
* Only users with admin permissions can use it. If you do not have admin permissions, you do not see the tab.
To open it:
1. In the left menu, select **Dashboards** under **ANALYZE**.
2. Select **Advanced settings**.
3. Select the **QuickSight Authoring** tab.
## Related pages
Dashboards you build yourself, under **Analyze > Analytics**.
Define the metrics that power dashboard widgets.
Ask Wren about your conversation data in natural language for ad-hoc analysis.
## Managed or self-serve?
| | Managed dashboards | Self-serve dashboards |
| ----------------- | ----------------------------------------------------------------------------------------- | ------------------------------------- |
| Where | **Analyze > Dashboards** | **Analyze > Analytics** |
| Who builds it | PolyAI, with your team. Your team can also build them if you enable QuickSight Authoring. | You, or Wren |
| How you change it | Request a change from your account manager, or use QuickSight Authoring | Edit it yourself at any time |
| Best for | Bespoke KPIs, complex data joins, board reporting | Day-to-day metrics and fast iteration |
Both types are embedded in Agent Studio. You do not need a separate login or an external tool.
## Find your dashboards
1. In the left menu, select **Dashboards** under **ANALYZE**.
2. Select the dashboard you want to open.
Each dashboard appears as a card with its name. Cards that PolyAI builds and maintains are marked **View only · by PolyAI**.
If your project has no dashboards yet, the page shows **No dashboards configured**. Contact your PolyAI team to set them up.
## What a managed dashboard includes
A managed dashboard can track any combination of metrics relevant to your use case. Common examples include:
| Metric | Description |
| ----------------------------- | ---------------------------------------------------------------------------------------------------- |
| **Containment rate** | Percentage of queries resolved by the agent without escalation or [handoff](/voice-channel/handoffs) |
| **Booking performance** | Success rates, conversion funnels, and failure reasons for booking interactions |
| **Call resolution breakdown** | Categorized call outcomes (resolved, transferred, abandoned) with drill-down capability |
| **Call flows and outcomes** | Visual maps of customer journeys showing which paths lead to successful resolution |
| **Revenue impact** | Bookings completed, upsells, or payments processed by the agent |
| **Custom function metrics** | Performance data from your specific [functions](/tools/introduction) and integrations |
Managed dashboards run on **Amazon Quick** (formerly Amazon QuickSight). PolyAI manages that connection for you.
## How to get a managed dashboard
Managed dashboards are available to enterprise customers.
1. Contact your PolyAI account manager.
2. Agree the metrics and KPIs you need.
3. PolyAI designs and builds the dashboard.
4. Review the dashboard in your Sandbox environment.
5. PolyAI deploys it for your team.
## Advanced settings
Select **Advanced settings** to see the dashboard connection for your project. PolyAI configures this during setup, so most teams never need to open it. It is where a dashboard gets linked, given a URL name, and scoped to a single project.
If a dashboard fails to load, the page reports one of two problems:
* The dashboard is not available on Amazon Quick. Check that it still exists.
* The dashboard filters are configured incorrectly on Amazon Quick.
Contact your PolyAI team if you see either message.
### QuickSight Authoring
QuickSight Authoring lets your team create and edit QuickSight dashboards directly. Use it when you want to change a managed dashboard without a request to your account manager.
Two conditions apply:
* QuickSight Authoring is available on demand to enterprise customers. To enable it, contact PolyAI.
* Only users with admin permissions can use it. If you do not have admin permissions, you do not see the tab.
To open it:
1. In the left menu, select **Dashboards** under **ANALYZE**.
2. Select **Advanced settings**.
3. Select the **QuickSight Authoring** tab.
## Related pages
Dashboards you build yourself, under **Analyze > Analytics**.
Define the metrics that power dashboard widgets.
Ask Wren about your conversation data in natural language for ad-hoc analysis.